Our Klamath Basin Water Crisis
Upholding rural Americans' rights to grow food,
own property, and caretake our wildlife and natural resources.
Our Klamath Basin
Water Crisis
Upholding rural Americans' rights to grow food,
own property, and caretake our wildlife and natural resources.
|
A Siskiyou County
Perspective Narrative accompanying "A Siskiyou County Perspective" – a power point presentation given on June 7, 2004 at the Lower Klamath River Basin Science Conference at Humboldt State University by Marcia H. Armstrong, Siskiyou County Supervisor.
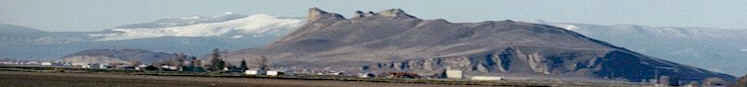
SLIDE #2: Siskiyou County has also lost about 1,000 children from our schools over the past 5 years. The County is currently experiencing a boom in retirees settling in Siskiyou County. The demographic trend is toward a poor aging population. Aging could affect land use as new developments encroach upon agricultural lands, particularly in the Shasta Valley. SLIDE #3 : There are currently vast amounts of open space in Siskiyou County. Public lands comprise the majority landholding, with less than half of the land base in private land ownership Of private land, there is a large amount of forested and farmland acreage and only a very small amount of land in urban development. SLIDE #4: The mid-Klamath area includes the Shasta, Scott and Salmon River areas. The philosophical perspective, regulatory emphasis, species and habitat type vary from the Upper Klamath and the Lower Klamath Basin. SLIDE #5: Shasta Valley (figures taken from CARA – California Rivers Assessment): More than half of the property is privately held, but only a small portion of that is in irrigated agriculture. SLIDE #6: (Map from ICE) The Shasta Valley is a volcanic debris flow that was described by early explorers as a "bleak undulating plain." The hydrology of the Shasta Valley is influenced by Mt. Shasta at 14,000 ft. elevation. Runoff from Mt. Shasta enters porous volcanic soils and pops up as springs in the valley floor. This is an important dynamic for salmonids. Shasta River begins in the Eddy Mountains and flows north for about 50 miles, meandering through the flat valley before it enters into a seven mile canyon ending in a confluence with the Klamath. River. Chinook and Coho salmon prefer a <3% gradient, while steelhead prefer 4-8%. Most of the Shasta Valley is broad and relatively flat, with low gradient river reaches. SLIDE #7: (Map from ICE) The Shasta Valley lies on the edge of the Great Basin. Precipitation averages about 26", and about 75-80% of that falls between October and March. (Compare this with the coastal Mad River watershed which averages 65 inches precipitation.) The blue areas of higher precipitation are the Eddy’s (mountain range) and Mount Shasta. Although average summer ambient air temperatures run around 72 degrees F, nights tend to be cold and daytime temperatures often exceed 100 degrees F. With water temperature tolerances for salmonids running 30 degrees below that, you can see why water temperatures can be a limiting factor. Dr. Dan Drake did a report in 2001 comparing water temperatures under various historic river flow levels and found the temperature remained about the same regardless of flow. SLIDE #8 the dams on the Shasta can be a factor limiting habitat. Slack water behind flashboard dams lower in the river can encourage warm water temperatures and algae blooms. The Fiock dam, one of the lowest on the river, has been removed and replaced with a pump. Dwinnell dam most likely affects recruitment of spawning gravel. It should be noted that Lake Shastina, formed behind Dwinnell, is one of our fastest growing communities with custom retirement homes the norm. Water impounded behind Dwinnell is used by the City of Montague as well as for irrigation. All but 8-10 cfs of Dwinnell’s outflow goes to the Montague Irrigation District. Most of the flow to the Shasta below the dam is spring-fed. Because of the volcanic nature of the valley, localized groundwater can be of poor quality or not easily located. Groundwater development in some areas, such as Big Springs, has been found to affect natural cold water springs and seeps that provide cold river water refugia. There are four major irrigation districts on the Shasta. The Shasta Valley is a gold mining area and most water use rights date back to the Gold Rush. The Shasta system was adjudicated very early in the 20th century and remains in the jurisdiction of Siskiyou County Superior Court. The adjudication names about 100 water users, including irrigation districts. Main Shasta, Upper Shasta, Little Shasta and Parks Creek water uses are watermastered. SLIDE #9: You can see the meander in the Shasta across the low gradient valley. Note the differences in the vegetation on the banks of riparian areas. In some areas of the Shasta one side of the river will have very alkaline or anaerobic soils. Many trial plantings have shown that establishment of riparian vegetation in these areas is difficult, if not impossible. SLIDE #10: These are the primary limiting factors to anadromous fish identified in the Shasta system. SLIDE #11: These are the "top three study needs" identified for the Shasta River by Dave Webb for the Shasta Valley RCD and Shasta River Coordinated Resource Management Planning Group. SLIDE #12: (Information from CARA and Bennett-DWR) In the Scott Valley, a little more than half of the land base is in private land, with a substantial amount in public ownership. Note that the irrigated acreage is relatively small. The amount of water used since the 1980s has been about the same although domestic use has climbed. In 1958, irrigation use was comprised of 2% groundwater, 12% mixed surface and groundwater and the remaining 86% of surface water. By the year 2000, irrigation is now comprised of 50% groundwater. According to Bill Bennett of the DWR, with the exception of an unexplained anomaly, there does not appear to be evidence of overdraft and fall rains seem to regularly recharge the aquifer. The Scott Valley is a gold mining area and most water use rights date back to the Gold Rush. Water rights in the Scott River were adjudicated in the late 1970s. There are about 600 individual water diversions named. The adjudication also includes a narrow band of riparian land where groundwater related to surface flow has been delineated. Five Creeks in the Scott River system are watermastered. The main stem and other tributaries are not. Siskiyou County Superior Court retains jurisdiction. SLIDE #13: (Map from ICE) as we move west toward the coast, we find the area becomes more mountainous. Here we see that less than a quarter of the land is at 7% or less gradient. There are many stream reaches that exceed the preferred habitat gradient for Coho or Chinook. SLIDE #14: (Map from ICE some information from Bennett-DWR) Also, as we move west toward the coast, we find that the average amount of precipitation increases. Of particular note in the Scott Valley is the marked rain shadow effect caused by the 7-8,000 foot mountains to the west and south. Most of the precipitation falls on the west side stored as snow pack above the 5,500 foot level. The higher mountains may see 60-80 inches, while the east side sees only 12-15 inches. Compared to the moderated Shasta, the Scott tends to be a "flashy" system that responds to precipitation events with a big outflow. The Scott is a gaining system augmented along the way by snow-fed tributaries originating in the high mountains. From 1936-1999 precipitation readings on Etna Mountain, there has been a trend toward less precipitation and less snow pack. In the Scott Valley, although average temperatures are around 70 degrees F, daily summer ambient air temperatures often exceed 100 degrees F in July and August. In addition large boulders in the canyon to the north seem to absorb heat. The river has also widened substantially in places over the last 150 years. Summer water temperatures are a limiting factor for salmonids. A FLIR study done on July 25, 2003, (an average water year,) by the NCRWQCB appears to show that the main stem river reaches lethal temperatures for salmonids in July from the top to the bottom of the river. This includes the Scott River canyon area, which is largely public Forest land. There are, however, scattered refugial areas of springs and cooler tributaries in the west and south. SLIDE #15: Here are slides of the rain shadow effect on the vegetation. Notice the juniper encroachment on the eastern hills. Photo comparisons show this has happened in the past 100 years, taking over natural grasslands. In the south and east, fire suppression, moratoriums on harvest and other factors have contributed to substantial forest undergrowth and large stands of suppressed growth trees. The dense upland vegetation has been identified as affecting the hydrology. SLIDE #16: Another remarkable feature of the Scott River are the dredger tailing piles that run for a distance of about 6 miles from Callahan near the head of the valley down to French Creek. The Yuba gold dredge ran this section from the 1930s-1940s. Scott Valley has many areas impacted by historic gold mining. The Scott River is prone to periodic flooding with accompanying erosion. In the 1930s, the Army Corps of Engineers straightened the main stem. Of course, this increased the river’s velocity and encouraged down cutting and loss of native vegetation. Now there is a marked disconnect between the water table and the flood plain. SLIDE #17: Three very small retention dams are located on high mountain Wilderness lakes. Some diverters also use seasonal gravel "push up dams" for surface water diversion. River flows are very dependent upon precipitation stored as snow pack. Rain on snow, low precipitation years and hot weather can dramatically affect the amount and timing of flow. Loss of the root systems of native riparian vegetation and connectivity with the flood plain has reduced the system’s ability to store water in the soil profile like a sponge. It tends to drain out like a bathtub by late July- August. According to Bill Bennett – DWR, the drying out of streams is a natural phenomenon. For example, in normal years, Kidder Creek will go dry about July 1. It has been calculated that without irrigation diversions, this dry date would move about a month later. In the main stem Scott, flows drop below the alluvial fan in the valley and pop back to the surface at the start of the canyon area. SLIDE#18 These show the range of riparian habitat from the raw exposed gravel of the dredger tailings, to the sandy braided area of the east, deep pool area of French Creek and deeper forested area of Canyon Creek. SLIDE#19: These are primary limiting factors to anadromous fish identified in the Scott River Watershed Council’s Strategic Plan for the Scott River system. SLIDE #20: These are the "top three study needs" identified for the Scott River by Gary Black of the Siskiyou RCD. SLIDE #21: (Information from CARA) Here you see that the Salmon River area is very sparsely inhabited. 99% of the land base is in public National Forest land and a large portion of that in protected (Wilderness) status. SLIDE#22: Looking at the slope, we see that it is steep terrain with less than 6% of the land at the 7% or less gradient. SLIDE#23 Precipitation has increased markedly as we have moved west at an average 0f 56.54 inches per year. Ambient air temperatures continue to be high in the summer months, often exceeding 100F. SLIDE # 24: Landslides are a major problem in the Salmon River. I am told that when this one let lose it buried a car. Forest fires in the area can also be a source of erosion. Suppression of fire, insect damage and a moratorium on timber management has created forest overgrowth and a potentially dangerous fire situation. SLIDE# 25: You can see that much of Salmon River is steep canyon. It is know for its world class white water rafting. There are also tremendous deep canyon pools where you can see the shadows of anadromous fish. SLIDE # 26: Although the Salmon River Restoration Council is in the process of doing limiting factors analysis, these are some primary limiting factors that have been identified. SLIDE # 27: These are the "top three study needs" identified in discussions with Petey Brucker of the Salmon River Restoration Council. SLIDE #28: Summary of Points. SLIDE #29: Top three study needs identified by speaker.
|
Home
Page Updated: Thursday May 07, 2009 09:14 AM Pacific
Copyright © klamathbasincrisis.org, 2004, All Rights Reserved