Our Klamath Basin Water Crisis
Upholding rural Americans' rights to grow food,
own property, and caretake our wildlife and natural resources.
Our Klamath Basin
Water Crisis
Upholding rural Americans' rights to grow food,
own property, and caretake our wildlife and natural resources.
|
http://www.heraldandnews.com/articles/2005/06/23/news/water/water.txt
Lakes, rivers
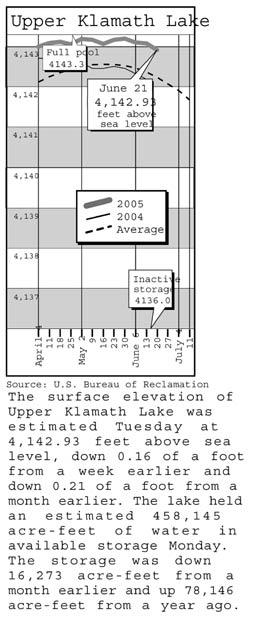
June 23, 2005 Clear Lake - The surface
elevation of Clear Lake as of Monday, June 20 was
4,524.39 above sea level, and its storage Gerber Reservoir - The
surface elevation of Gerber Reservoir as of Monday,
June 20 was 4819.95 above sea level, and its storage
was 42185 acre feet. The lake elevation was up from
1.58 feet a year earlier, and the storage was up
4509 acre feet from a year earlier. June 16 1,430 1,735 June 17 1,270 1,312 June 20 1,330 1,062 June 14 1,000 823 June 16 1,000 1,060 June 18 1,000 826
|
Home
Page Updated: Thursday May 07, 2009 09:14 AM Pacific
Copyright © klamathbasincrisis.org, 2005, All Rights Reserved