Our Klamath Basin Water Crisis
Upholding rural Americans' rights to grow food,
own property, and caretake our wildlife and natural resources.
Our Klamath Basin
Water Crisis
Upholding rural Americans' rights to grow food,
own property, and caretake our wildlife and natural resources.
|
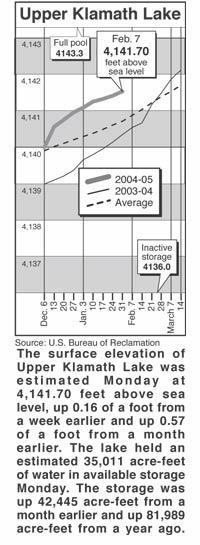
Lakes, rivers
February 9, 2005
Following are daily averages of the volume of water
flowing at key points in the Klamath Basin, measured
in cubic feet per second: Feb. 1 265 606 Feb. 3 270 578 Feb. 5 377 675 Feb. 7 495 509 Feb. 1 422 834 Feb. 3 318 751 Feb. 5 412 811 Feb. 7 404 810 Feb. 1 1,040 1,312 Feb. 3 855 1,312 Feb. 5 802 1,312 Feb. 7 803 1,312 Feb. 1 1,383 2,359 Feb. 3 1,016 1,279 Feb. 5 1,155 1,727 Feb. 7 2,051 1,561 below Sprague R. 2005
Avg. Source: U.S. Bureau of
Reclamation, U.S. Geological Survey, Oregon Water
Resources Department.
|
Home
Page Updated: Thursday May 07, 2009 09:14 AM Pacific
Copyright © klamathbasincrisis.org, 2005, All Rights Reserved